Downloading the Census Household Pulse Survey in R
The Census Household Pulse Survey is awesome. Weekly/biweekly data on how Americans are coping during the pandemic? Beautiful! Freely accessible microdata? Stunning! Questions on everything from finances to vaccines?? We love to see it.
However, the download options leave a bit to be desired. Unlike standard Census fare, like the American Community Survey, the Household Pulse Survey doesn’t have an API (yet?). Instead, if you visit the “Public Use File” release page, you will find a bunch of individual links to csv files or SAS files. And those links, in fact, lead you to a zip file containing the raw data, the survey weights, and (shudder) an Excel-spreadsheet codebook.
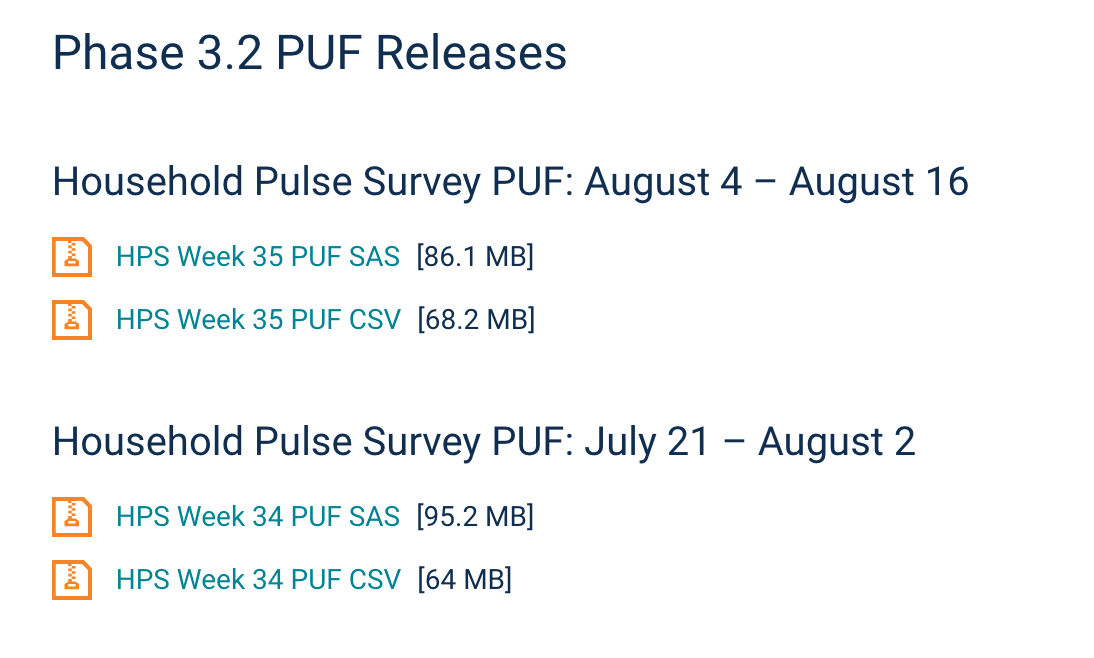
Census Household Pulse Survey download options
There are 35 waves of the survey available so we definitely don’t want to start clicking on each one. Let’s scrape them!
If you just want to run the code and skip the gory details, you can find the R script here. Otherwise, let’s get stuck in!
First step, use the rvest and httr packages to GET the underlying HTML of the downloads page:
GET("https://www.census.gov/programs-surveys/household-pulse-survey/datasets.html") %>%
  read_html()
## {html_document}
## <html dir="ltr">
## [1] <head>\n<title>Household Pulse Survey Public Use File (PUF)</title>\n<sty ...
## [2] <body>\n<div><script type="text/javascript">\r\n\tvar d = new Date();\r\n ...Now we want to find the download links within that HTML. The easiest way to do this is to load the web page in a browser and use right click –> Inspect to bring up the Developer Tools:
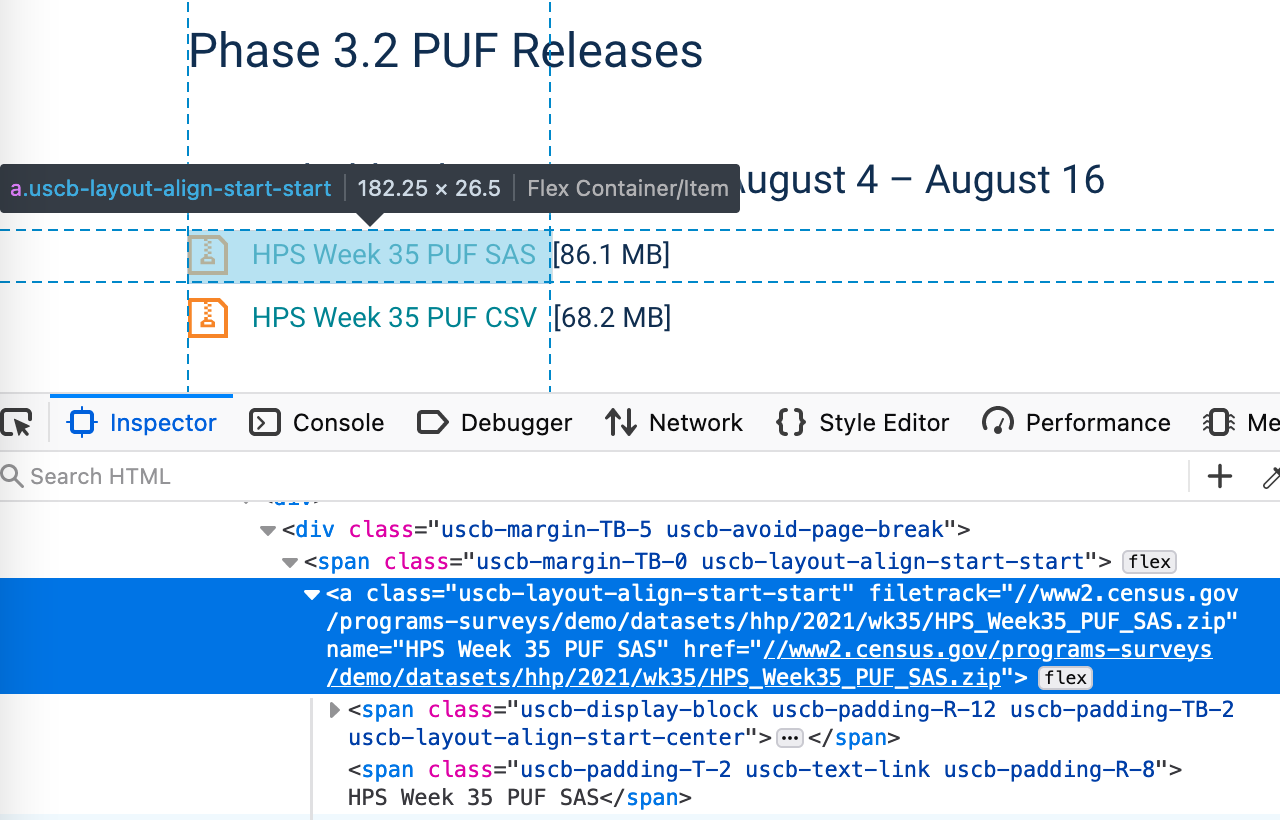
Finding the URLs using Firefox’s “Inspector”
In HTML, hyperlinks are captured within the <a> tag, and I can see in addition that the links I want have the class uscb-layout-align-start-start. (The class name itself is unlikely to be meaningful to us, it’s just a way to apply specific formatting rules to those links in the CSS.)
So let’s take that raw HTML and select the <a> tags with class uscb-layout-align-start-start. (Here I’m piping that into the head() function so we only see the first 6 rows, just to save space…)
GET("https://www.census.gov/programs-surveys/household-pulse-survey/datasets.html") %>%
  read_html() %>%
  html_elements("a.uscb-layout-align-start-start") %>%
  head()
## {xml_nodeset (6)}
## [1] <a class="uscb-layout-align-start-start" filetrack="//www2.census.gov/pro ...
## [2] <a class="uscb-layout-align-start-start" filetrack="//www2.census.gov/pro ...
## [3] <a class="uscb-layout-align-start-start" filetrack="//www2.census.gov/pro ...
## [4] <a class="uscb-layout-align-start-start" filetrack="//www2.census.gov/pro ...
## [5] <a class="uscb-layout-align-start-start" filetrack="//www2.census.gov/pro ...
## [6] <a class="uscb-layout-align-start-start" filetrack="//www2.census.gov/pro ...We don’t actually want the whole <a> tag though, just the download URL. That is stored as an attribute of the tag, named href. So we can use the html_attr function to extract it:
census_urls <- GET("https://www.census.gov/programs-surveys/household-pulse-survey/datasets.html") %>%
  read_html() %>%
  html_elements("a.uscb-layout-align-start-start") %>%
  html_attr("href")

head(census_urls)
## [1] "//www2.census.gov/programs-surveys/demo/datasets/hhp/2021/wk35/HPS_Week35_PUF_SAS.zip"
## [2] "//www2.census.gov/programs-surveys/demo/datasets/hhp/2021/wk35/HPS_Week35_PUF_CSV.zip"
## [3] "//www2.census.gov/programs-surveys/demo/datasets/hhp/2021/wk34/HPS_Week34_PUF_SAS.zip"
## [4] "//www2.census.gov/programs-surveys/demo/datasets/hhp/2021/wk34/HPS_Week34_PUF_CSV.zip"
## [5] "//www2.census.gov/programs-surveys/demo/datasets/hhp/2021/wk33/HPS_Week33_PUF_SAS.zip"
## [6] "//www2.census.gov/programs-surveys/demo/datasets/hhp/2021/wk33/HPS_Week33_PUF_CSV.zip"OK, great! We’re almost there on the URLs. Now we just need to filter out the SAS files, and also add the prefix “https:” to the URL string:
# subset to just the CSV files
census_urls <- census_urls[str_detect(census_urls, "CSV.zip")]
census_urls <- paste0("https:", census_urls)
head(census_urls)
## [1] "https://www2.census.gov/programs-surveys/demo/datasets/hhp/2021/wk35/HPS_Week35_PUF_CSV.zip"
## [2] "https://www2.census.gov/programs-surveys/demo/datasets/hhp/2021/wk34/HPS_Week34_PUF_CSV.zip"
## [3] "https://www2.census.gov/programs-surveys/demo/datasets/hhp/2021/wk33/HPS_Week33_PUF_CSV.zip"
## [4] "https://www2.census.gov/programs-surveys/demo/datasets/hhp/2021/wk32/HPS_Week32_PUF_CSV.zip"
## [5] "https://www2.census.gov/programs-surveys/demo/datasets/hhp/2021/wk31/HPS_Week31_PUF_CSV.zip"
## [6] "https://www2.census.gov/programs-surveys/demo/datasets/hhp/2021/wk30/HPS_Week30_PUF_CSV.zip"Looking good! Now let’s loop over each URL, download the ZIP file, and unzip it in our specified directory. We also need to specify the filenames when we download, so let’s extract those from the URls too. We can use str_split to split the URL in two around the string “HPS_”. The second half will give us a short and unambiguous file name (e.g. “Week30_PUF_CSV.zip”).
# save list of file names
census_filenames <- unlist(lapply(str_split(census_urls, "HPS_"), function(x)(x[2])))

# download each zip file
for (i in 1:length(census_urls)){
  download.file(census_urls[i],
                destfile = paste0("Data/Census_HPS/Raw/",census_filenames[i]))
}

# unzip
for (i in 1:length(census_urls)){
  unzip(paste0("Data/Census_HPS/Raw/",census_filenames[i]), exdir="Data/Census_HPS/Raw/")
}
As you can see, we’ve downloaded all these files to a particular subdirectory - highly recommended since we’re going to have 35 zip files, which unzip to 35 * 3 individual files!
So close now! We just need to load the raw data csv files into R (excluding the weights files and the data dictionaries), and then bind them all together into “long” format.
Note: the datasets are fairly chunky to loading all 35 will take a few minutes. (You can probably speed this up a bit using the fread function from the data.table package instead of read_csv, if you are so inclined…)
# list all files in directory
file_list <- list.files("Data/Census_HPS/Raw/")

# select just the raw data
# (not the weights files or the data dictionaries)
file_list <- file_list[str_detect(file_list, ".csv") & !str_detect(file_list, "repwgt")]
# bind together
hps <- paste0("Data/Census_HPS/Raw/", file_list) %>%
lapply(read_csv) %>%
bind_rows()Et, voilà! We have a looooong dataset of about 2.9 million observations, ranging from wave 1 (April 2020) to wave 35 (August 2021)! Remember, of course, that not every question was asked in every wave (e.g. vaccine hesitancy was not measured until the COVID vaccines had been developed).
Here’s a quick example of what we can do with this dataset. (Note: I have not applied any survey weights to these estimates, this is just an illustration!)
hps %>%
  select(WEEK, ANXIOUS) %>%
  mutate(anxious_mostdays = case_when(ANXIOUS<0 ~ NA_real_,
                                          ANXIOUS %in% c(1,2) ~ 0,
                                          ANXIOUS %in% c(3,4) ~ 1)) %>%
  group_by(WEEK) %>%
  summarize(mean_anxious_mostdays = mean(anxious_mostdays, na.rm=TRUE)) %>%
  ggplot(aes(x=WEEK, y=mean_anxious_mostdays*100)) +
  geom_line() +
  theme_minimal() +
  xlab("HPS wave") +
  ylab("") +
  ylim(0, 40) +
  labs(title = "% feeling anxious most days last week",
       subtitle = "Unweighted (due to laziness)",
       caption = "Source: Census Household Pulse survey")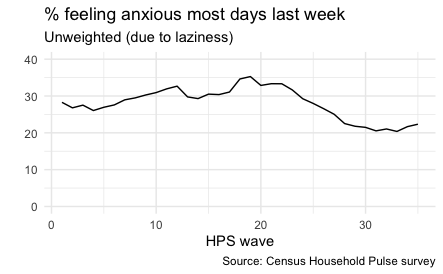
Graph of anxiety during the pandemic
Want to give it a go? Full code is on my Github here.